Ferry Point (Bridge) Weekly Tide Tables and Charts
Tide Chart for Next 7 Days
Ferry Point (Bridge) weekly tide chart key:
The tide chart above shows the times and heights of high tide and low tide for Ferry Point (Bridge), for the next seven days. The red line highlights the current time and estimated height.The tidal range at Ferry Point (Bridge) for the next seven days is approximately 1.84 ft with a minimum tide of 0.24 ft and maximum tide of 2.08 ft. You can also check out all the daily details on tides & fishing times on the Day tab for Ferry Point (Bridge).
Tide Table for Next 7 Days
▲ Blue = High Tide
▼ Red = Low Tide
| Day | 1st Tide | 2nd Tide | 3rd Tide | 4th Tide | ☀ Sun |
Major Solunars
|
Minor Solunars
|
|
|---|---|---|---|---|---|---|---|---|
| 16 Wed |
|
▲ 2.08 ft |
▼ 0.25 ft |
▲ 1.72 ft |
▼ 0.3 ft |
▲ 6:31 AM ▼ 7:44 PM |
3:25 AM → 5:25 AM 3:53 PM → 5:53 PM |
8:08 AM → 9:08 AM 11:39 PM → 12:39 AM |
| 17 Thu |
|
▲ 2.03 ft |
▼ 0.33 ft |
▲ 1.66 ft |
▼ 0.36 ft |
▲ 6:30 AM ▼ 7:45 PM |
4:16 AM → 6:16 AM 4:43 PM → 6:43 PM |
8:50 AM → 9:50 AM |
| 18 Fri |
|
▲ 1.97 ft |
▼ 0.41 ft |
▲ 1.62 ft |
▼ 0.41 ft |
▲ 6:28 AM ▼ 7:46 PM |
5:08 AM → 7:08 AM 5:35 PM → 7:35 PM |
12:37 AM → 1:37 AM 9:40 AM → 10:40 AM |
| 19 Sat |
|
▲ 1.93 ft |
▼ 0.46 ft |
▲ 1.6 ft |
▲ 6:27 AM ▼ 7:46 PM |
6:02 AM → 8:02 AM 6:26 PM → 8:26 PM |
1:30 AM → 2:30 AM 10:37 AM → 11:37 AM |
|
| 20 Sun |
|
▼ 0.45 ft |
▲ 1.89 ft |
▼ 0.48 ft |
▲ 1.6 ft |
▲ 6:26 AM ▼ 7:47 PM |
6:56 AM → 8:56 AM 7:18 PM → 9:18 PM |
2:16 AM → 3:16 AM 11:41 AM → 12:41 PM |
| 21 Mon |
|
▼ 0.45 ft |
▲ 1.88 ft |
▼ 0.45 ft |
▲ 1.65 ft |
▲ 6:25 AM ▼ 7:48 PM |
7:48 AM → 9:48 AM 8:09 PM → 10:09 PM |
2:56 AM → 3:56 AM 12:49 PM → 1:49 PM |
| 22 Tue |
|
▼ 0.41 ft |
▲ 1.89 ft |
▼ 0.37 ft |
▲ 1.76 ft |
▲ 6:23 AM ▼ 7:49 PM |
8:40 AM → 10:40 AM 8:59 PM → 10:59 PM |
3:30 AM → 4:30 AM 1:59 PM → 2:59 PM |
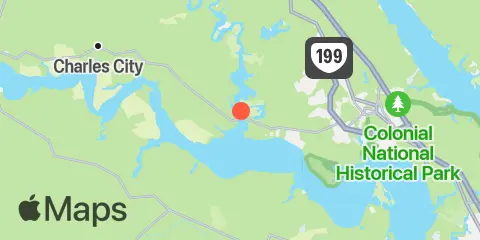
Location & Map
Latitude
37° 15' 48" N (37.2633)
Longitude
76° 52' 36" W (-76.8767)
State
County
Nearest ZIP
23185
Nearby
Tides
4.0 mi
Tettington, James River
4.5 mi
Claremont, James River
5.6 mi
Jamestown Wharf, Jamestown
5.7 mi
Wright Island Landing, Chickahominy River
7.5 mi
Scotland, James River
7.8 mi
Sturgeon Point, James River
9.9 mi
Lanexa, Chickahominy River
12.1 mi
Kingsmill, James River
Currents
0.1 mi
Chickahominy River Bridge
4.7 mi
Caremont Landing
6.1 mi
Brandon Point, 0.3 mile northeast of
6.6 mi
Jamestown Island, Church Point
11.1 mi
Hog Point
Note: Tide predictions are an estimate and NOT FOR NAVIGATION.
We also offer free widgets if you want to add tide or solunar tables to your own site.